The Robert Wood Johnson Foundation released its 2018 report on the health of nearly every county in the nation. Below, we’ve taken a look at the most relevant findings for Pennsylvania.
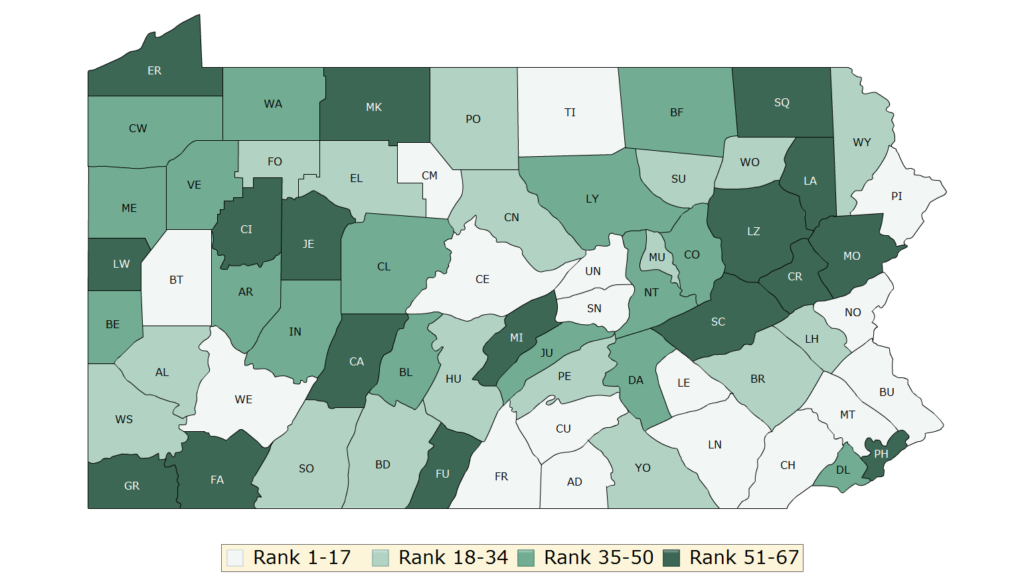
County Rankings
The map below shows the disparities in health outcomes between Pennsylvania counties. The lighter the color, the better the outcomes. Philadelphia ranks last in health outcomes. Many rural counties also rank very low as compared to the higher-performing suburban counties.
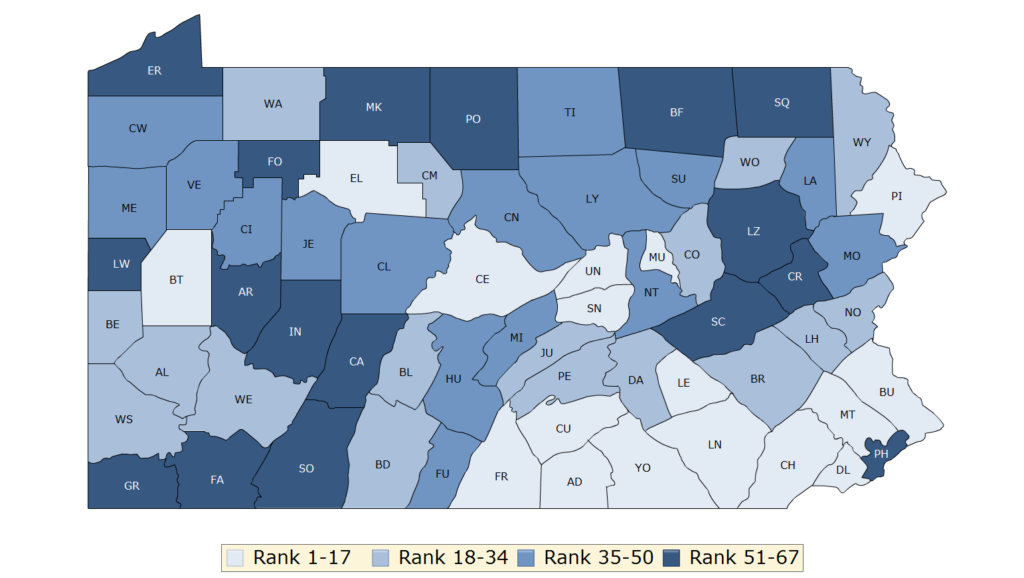
County Health Factors
Health outcomes are influenced by health factors, defined by RWJF as “the factors that drive how long and how well we live, including health behaviors (tobacco use, diet & exercise, alcohol & drug use, sexual activity), clinical care (access to care, quality of care), social and economic factors (education, employment, income, family & social support, community safety), and the physical environment (air & water quality, housing, & transit).” The map below shows county rankings by health factors. The lighter the blue, the better the county’s performance.
Health Equity
Health disparities in Pennsylvania are masked when we look only at geographic data. Health disparities emerge when some groups have more access to opportunities and resources over their lifetime and across generations. The report shows that in Pennsylvania:
- American Indians/Alaskan Natives are most similar in health to those living in the healthiest quartile of counties.
- Asians/Pacific Islanders are healthier than those living in the top ranked county.
- Blacks are less healthy than those living in the bottom ranked county.
- Hispanics are most similar in health to those living in the least healthy quartile of counties.
- Whites are most similar in health to those living in the middle 50% of counties.
Achieving health equity means reducing and ultimately eliminating these unjust and avoidable differences.
To read the full report, click here.